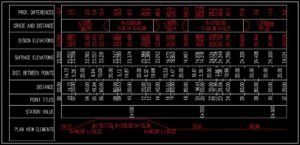
We’ve already discussed how to add custom stations along an Alignment and then how to set up Alignment and Sample Line Labels so we can have fully working custom stations along our Alignments.
Today we are going to look at how to set up Profile view bands for Station Equations and Sample Lines, so we can have our custom stations shown in the profile view too!
Setting up Profile view bands for Station Equations
We will start up with profile bands for Equations. Knowing that they are very powerful and easy to use. But we also know that there is a chance to mess things up using equations. Let’s take a look at profile bands and how to set them up:
- Firstly we have to be aware of band types we are using, and what is the date showing in there. Since in every country there are different standards your bands may look different than mine. However here is the data I have in mine template:
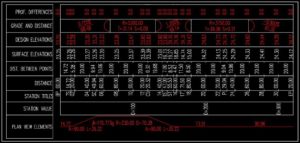
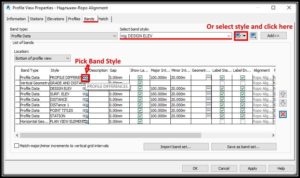
As you can see there are our Station Equations 14′ and 17′ they are all set up and good looking. - We will start organizing the date about equations from the beginning. Now we right-click on our bands and go to Profile View Properties.. in the new window that pops up we have to go under the Bands tab and click on Pick Band Style button.
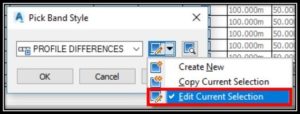
- We go and click on Edit Current Selection
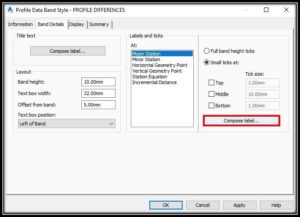
- A new window will pop up called Profile Data Band Style here under the Band Details tab we can see Labels and Ticks menu. This are the band settings for all types of stations Major, minor, horizontal geometry, vertical geometry, Station equation, and Incremental distance. Now we have to select one of the already set up bands like Major stations and click on Compose Label.
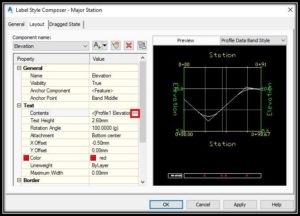
- In the new window called Label Style Composer under Layout tab, we can see our components with all their properties. They include – name, visibility, anchor component, text high, rotation angle and much more! There is a row called Contents we can enter in contents menu by clicking on 3 dots on the right side.
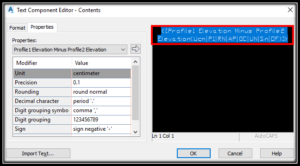
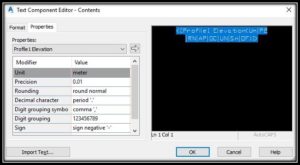
- Now we are in the Text Component Editor window and there is a text that defines the text in our bands. We just have to Copy that text and Paste it into the Text Component Editor of Station Equation band type. (repeat steps 4 and 5)
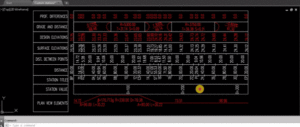
That’s it our band is now set up and will show Equation’s data just as if it was a Major station. The process has to be repeated for all the bands where we want to have Station Equation data.
Note: If you don’t have Station Equation band set up you might need to set all the other properties like text high, rotation, anchor point, offset etc. They should be the same as properties in your Major Station bands.
Setting up Profile view bands for Sample Lines
This is a bit tricky because Sample Lines are not part of Profile Data band types. That’s why we will need to create an entirely new Band set for Sectional Data (Sample lines). If we want to add just several Sample lines along our Alignment they will look really strange in profile view.
So we will have to add sample lines along all major and minor stations. Which is not that hard, we just have to choose By range of stations.. option when we are creating the sample lines. There we will be able to choose an incremental distance and Additional Sample Control like At Horizontal Geometry Point.
However, this can take some time and the biggest drawback is that Horizontal Geometry points won’t have their specific names like SC (Spiral-Curve) or TC (Tangent – Curve).
Now, if we don’t care about those drawbacks we can start setting up our bands for sample lines.
- Firstly we go to Bands tab in Profile View Properties window. In Band Type, we choose Sectional Data and then we Create New.
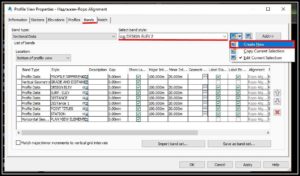
- A window will pop up – Sectional Data Band Style which is almost identical to the Profile Data Band Style. Now we have to choose the band type. For example, we will create a Design Elevation band for our Sample lines. Here under Labels and Ticks, we see At Sample line Station, we choose that and hit Compose label.
- Label Style Composer window is absolutely identical to the one in Profile Data bands. Under Contents we will enter the text for our new bands. The good thing is that we can go to Profile Data bands and copy their text here it works the same! So under Contents, we Paste the text from the Profile Data Design Elevation band.
We will have to repeat the process for all the bands we need and then replace old band set with a new one. Here is the result:
